Разработка ПО
 Менеджмент
 Для компаний
 Для стартапов
 Архитектура ПО
Together with the Kyiv Institute of Gerontology, with the Department of Epigenetics, we decided to create a project aimed at a scientific way to take a step toward radical longevity. I came for a tour, they showed me the laboratories, after which we started the project. The essence of the project is that it is necessary to aggregate data from various genetic databases. This data is gene expression in various tissues. The tissues were taken by biopsy from various patients (who then had to be sorted by age groups). To put it simply, in a rough-and-ready way, the essence of the project is to find differences between the data of elderly and young people, which will allow us to hypothesize how we can slow aging.
https://sites.google.com/view/immortal-ingello/agi...
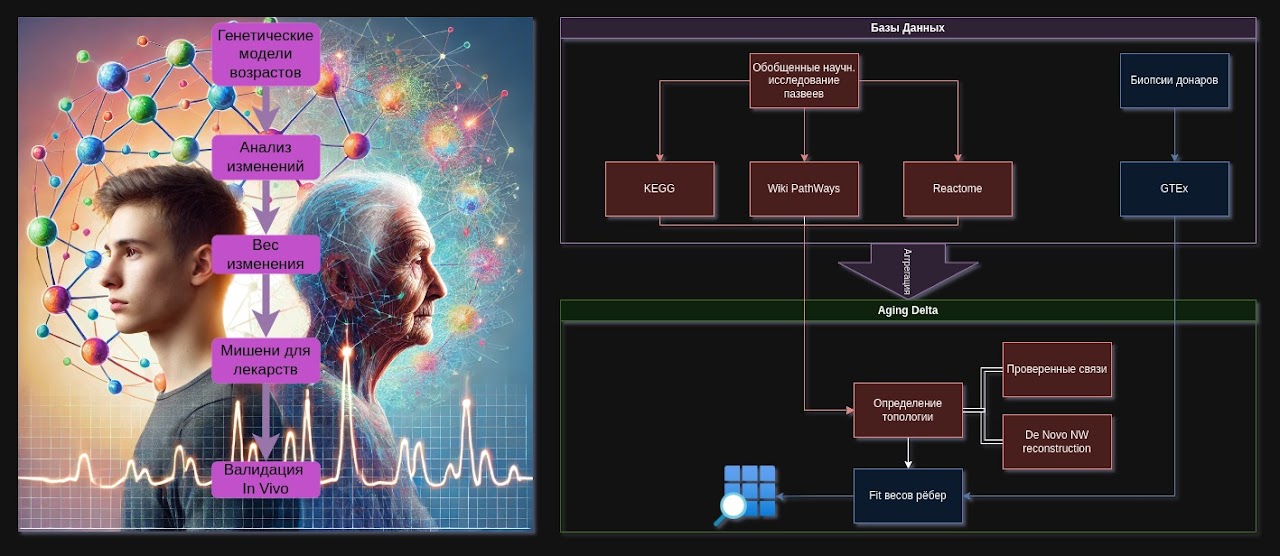
Project Aging Delta is aimed at creating a comprehensive graph model of changes in biological pathways during aging, combining data from leading knowledge bases (KEGG, Reactome, WikiPathways) and real expression profiles (GTEx). The project architecture is divided into infrastructure/software and biological/analytical parts, providing for data collection, structuring, graph construction, statistical/ML analysis, and, finally, biological interpretation of the results. The use of Domain-Driven Design (DDD) methods helps the team form a unified language (ubiquitous language) and interact effectively at the intersection of programming, gerontology, and bioinformatics.
I.1. General concept
- Description
- Aging Delta is an interdisciplinary project focused on studying aging processes at the level of genes, signaling pathways, and cellular interactions.
- The project combines data from several types of resources:
- Structural knowledge bases on pathways and signaling cascades (KEGG, WikiPathways, Reactome), where generalized information is stored about how genes, proteins, and metabolites interact.
- Real expression database (GTEx), containing biopsy results from different donors, which makes it possible to understand how actively each gene is “turned on” or “turned off” in different tissues and at different ages.
- Goal
- Create an integrated network model (graph/graphs) of the aging process taking age-related changes into account.
- Assess the contribution of individual genes and pathways to the development of pathological processes (oncology, neurodegeneration, etc.) and formulate hypotheses about “targets” (specific genes/proteins) for potential interventions (modulation).
- Tasks
- Aggregate data from structural databases (KEGG, WikiPathways, Reactome) and compare them with real expression data (GTEx).
- Build two or more graphs (for different age groups), or one shared graph with different weights (connection strengths) depending on age.
- Perform “edge fitting” (determining the strength of interaction/correlation) based on statistical or ML methods (see the article from PubMed, 37021935).
- Analyze the resulting networks in order to identify key changes in signaling pathways, their potential contribution to age-associated diseases, and determine targets for further research (for example, proteins that can be modulated chemically or epigenetically — by methylation, acetylation, inhibitors, etc.).
I.2. Terminology and domain language (Domain-Driven Design)
- Pathway — a sequence of biochemical reactions or signaling events (for example, mTOR pathway, MAPK pathway, etc.).
- Gene — a section of DNA encoding a protein or functional RNA.
- Protein — the product of gene expression, performing structural, enzymatic, regulatory, and other functions.
- Gene expression — the activity of a gene in a cell (determined by the amount of RNA or protein).
- Targets — potential points of application that drugs can act on (for example, a hyperactive protein that needs to be inhibited).
- Methylation/Acetylation — the main epigenetic mechanisms for modulating the activity of genes or proteins.
- Graph — a mathematical model of a network of interactions, where nodes are genes/proteins, and edges are their connections (expression correlation, direct physical interactions, etc.).
- Edge fitting — the process of selecting or calculating the “weight” of interaction between two nodes, based on experimental data (for example, from RNA-seq).
II. Structural databases and GTEx
II.1. Structural databases (KEGG, WikiPathways, Reactome)
- KEGG (Kyoto Encyclopedia of Genes and Genomes)
- Link
- Contains carefully annotated maps of pathways, metabolisms, and information about interactions between genes and proteins.
- WikiPathways
- Link
- A crowdsourcing platform where specialists and enthusiasts jointly maintain and update pathways.
- Reactome
- Link
- A database of signaling pathways with careful manual annotation and links to primary literature.
From these databases we take topology (who is connected to whom) and general information about functional interactions.
II.2. GTEx database (Genotype-Tissue Expression)
- Description
- Link
- Contains “raw” gene expression data (RNA-seq) from biopsies of different donors, as well as metadata (age, sex, tissue, etc.).
- Significance
- Allows us to see how genes are actually expressed in different tissues and ages.
- The data is needed for “fitting” the weight of connections (edges) in the graph, as well as for identifying patterns characteristic of aging.
III. Architecture and phases
III.1. Division into two parts
- Part A. (Programming and architecture domain)
- Collection (possibly using scripts and APIs) and cleaning of data from databases.
- Organization of data storage (DB, file storages).
- Implementation of aggregation logic (averaging, filtering, normalization).
- Construction of graphs (structure + edge weights) for different age groups or one shared graph with several sets of weights.
- Visualization of networks (JS/Canvas, D3.js, or Cytoscape.js).
- Support for the web interface (control panels, export/import of results).
- Part B. (Biochemistry, gerontology, statistical/ML analysis)
- Application of statistics and machine learning methods (WGCNA, differential expression, co-expression analysis).
- Biological interpretation of the resulting networks: search for key modules, genes, signaling pathways.
- Formation of hypotheses about targets (which protein shows hyperactivity during aging, or the opposite).
- Proposal of strategies for target modulation (inhibition, activation, methylation, etc.).
- Final verification of results in biological experiments (in vitro, in vivo).
III.2. Project phases
- Phase: System and domain analysis
- Requirements gathering, study of the domain area, Domain-Driven Design (DDD) practices.
- Phase: Architecture design
- Development of the database schema, definition of formats for storing graphs, interaction protocol between Part A and Part B.
- Phase: Prototype creation
- Setting up a minimal environment (Docker, DB server, PHP/JS frontend).
- Import of test datasets (KEGG, GTEx).
- Phase: Data aggregation with age groups taken into account
- Division of donors in GTEx by age cohorts.
- If needed, combining (averaging) expression within each age group.
- Creation (or update) of the graph (two “Young/Old” graphs or one with different weights).
- Phase: Data normalization (if necessary)
- Elimination of technical artifacts, bringing expressions to a unified scale.
- Phase: Expression averaging, differential correlation, or WGCNA
- The methodology depends on the chosen analysis strategy (classical differential expression or construction of co-expression networks).
- Phase: Comparison (pinpoint) for different tissues
- Search for changes in topological properties: loss of centrality, change in clustering, etc.
- Phase: Optimization (as needed)
- Performance improvement (large graphs, processing large volumes of data).
- Phase: Visualization
- Development of interactive display tools (Canvas, D3.js, Cytoscape.js).
- Highlighting changes between ages.
- Phase: Statistical analysis and/or ML methods
- Search for patterns, clusters, key nodes.
- Use of learning algorithms (classification, regression, random forest, neural networks).
- Phase: Manual bio-clinical analysis
- Interpretation of results by gerontology specialists.
- Clarification of which pathways are actually related to oncology, neurodegeneration, etc.
- Phase: Building hypotheses about targets
- Formation of a list of potential genes/proteins (for example, a hyperactive protein that needs to be inhibited).
- Phase: Hypotheses for target modulation
- Proposal of specific interventions (inhibitors, methylation, acetylation) at the molecular level.
- Phase: Experimental validation
- In vitro experiments (use of cell lines, instruments: flow cytometer for analysis, qPCR to confirm expression, Western blot).
- In vivo experiments (model animals, observation of phenotype changes).
IV. Existing projects: similarities, differences, synergy
- Human Ageing Genomic Resources (HAGR)
- Link
- Contains GenAge (a database of genes associated with aging), AnAge (data on species lifespan).
- Helps identify “candidate” genes for our analysis.
- AgeFactDB
- Link (temporarily under reconstruction)
- A database of factors affecting the lifespan of different organisms.
- Open Targets
- Link
- A project for searching and prioritizing drug targets, but not purely about aging, rather about diseases in general.
- Aging.ai
- Link
- A model for predicting age by blood biomarkers, with less focus on network pathways.
- Geroprotectors.org
- A database of potential geroprotectors, but without deep network analytics.
All these resources provide partial information (genes, lifespan, factors), but do not provide the comprehensive “graph” model that we want to create in Aging Delta.
V. Typical problems and difficulties
- Data integration
- Heterogeneous formats and identifiers (genes by Ensembl, HGNC, NCBI, etc.).
- Age slices
- Often there is no clear longitudinal data for one person, so we have to average by groups.
- Lack of real dynamics
- Aging is a process, while in databases we usually have static “slices.”
- Noise and incompleteness
- RNA-seq and other methods produce variable data; statistical filtering is necessary.
- Interpretation of causes and effects
- A gene's association with age does not mean a cause-and-effect relationship.
- Multidisciplinarity
- Competencies in programming, mathematics, gerontology, and bioinformatics are required.
VI. Technology Stack
VI.1. Software (infrastructure) part
- Operating environments and tools
- Linux (server environment), Docker (containerization), Bash (automation scripts).
- Languages
- PHP (Yii/Laravel framework) — backend for the web application.
- SQL (MySQL) — a relational database for storing aggregated information.
- HTML/CSS/JavaScript — frontend, visualization via Canvas, D3.js or Cytoscape.js.
- Architectural solutions
- A microservice approach or a monolith with a clear separation of modules (DDD — “bounded contexts”).
- REST API or GraphQL (optional) for exchange with the analytics module.
VI.2. Bioinformatics and analytics part
- Languages and libraries
- Python: pandas, NumPy, SciPy, scikit-learn, PyTorch/TensorFlow (for ML if needed).
- R: Bioconductor (edgeR, DESeq2, limma), WGCNA, iGraph.
- Analysis approaches
- Differential expression (DESeq2), co-expression (WGCNA).
- Building correlation networks, “edge weight fitting” methods (article PubMed 37021935).
- Graph analysis: centrality, clustering, module search.
- Additional tools
- Jupyter Notebooks/R Markdown — reproducible research.
- Git — code and data versioning.
VI.3. Additional (marketing) tasks
- Infographics and diagrams
- Creating promotional materials (in Figma) to attract volunteers and investors.
- Schematic explanation of the architecture and operating principle.
- Website section
- Aggregation of project information, documentation, FAQ.
- UX/UI design of control interfaces (graph viewing, filtering, reports).
- Presentation
- Preparation of slides and posters for scientific conferences or investor pitches.
VII. Domain-Driven Design (DDD) practices
- Ubiquitous Language
- Using unified terms (gene, pathway, expression, edge weight, target) and having the development and biology teams understand them in the same way.
- Bounded Context
- Dividing the project into modules:
- “Data Aggregation Context” (data loading and normalization),
- “Network Construction Context” (graph construction),
- “Biological Analysis Context” (WGCNA, statistics, ML),
- “Visualization & UX Context” (web interface).
- Dividing the project into modules:
- Context Mapping
- Defining how these modules interact (APIs, data formats, intermediate CSV/TSV or SQL tables).
- Domain Events
- Events such as “age group data updated,” “graph recalculated,” “new network module discovered” can be formalized as domain events that affect the project logic.
VIII. Links and additional materials
- KEGG
- WikiPathways
- Reactome
- GTEx Portal
- PubMed (edge weight fitting method)
- Human Ageing Genomic Resources (HAGR)
- AgeFactDB
- Open Targets
- Aging.ai
- Geroprotectors.org
- Wikipedia (terms, definitions)
https://docs.google.com/document/d/1eEL9kFAerWu-DW...
This will help you understand GTEx in its original form. I made it so that it would be possible to get up to speed, but it is specifically for the project I am working on. Besides, the docs are raw, not the roughest draft, useful, but a lot is missing. Various scripts are attached to it, but they cannot even be run without separate docs for the scripts themselves and the infrastructure, and docs at that level exist only in my head and are not on the surface; I need to remember them
https://docs.google.com/document/d/14C07ODWNKPZXAu...
https://docs.google.com/document/d/16ji4anrUO6zZA6...
This is unlikely to be useful