Разработка ПО
 Менеджмент
 Для компаний
 Для стартапов
 Архитектура ПО
During the project, a loss of at least several tens of thousands of dollars on development was recorded due to an architectural error, which we will discuss in this article. On the other hand, innovative unique algorithms were invented during the project and almost genius decisions were made, which over time smoothed over the losses by accelerating the development process. Some of these decisions deserve, at minimum, a separate detailed engineering and technical article. In terms of the project's weight class, the client did not embellish the complexity and interest of the project at all, and perhaps even underestimated it; we had to work with a truly large and boundless project within the framework of the newest technologies and methodologies.
Оглавление
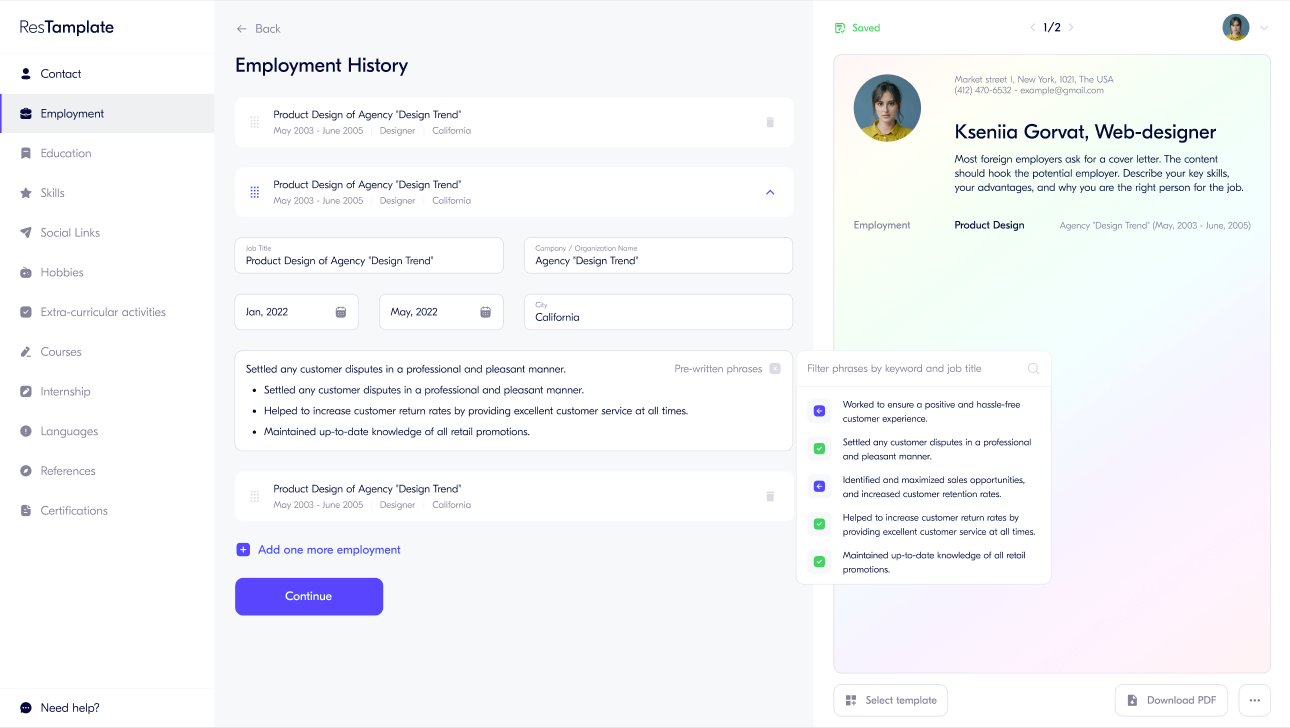
!!! Due to a very complex non-disclosure agreement, there will be practically no images in this case article. Only visualization of general front-end solutions.
In the summer of 2019, the technical director of the German company GadFull contacted us with a proposal to involve our team in the development of a major and innovative project. During development, we encountered challenges and tasks, some of which we still consider the most difficult in the entire history of our design and programming work.
Briefly: GadFull is a TOP 1 brand, a partner of Amazon, and in several countries a leader in various areas - smartphones, batteries, office equipment and consumables, tools, household goods. Hundreds of thousands of customers, thousands of reviews, a staff of analysts, extremely complex business processes.
In a few years, the client plans to obtain a multifunctional monitoring platform, partially controlled by artificial intelligence. Everything is simple (not).
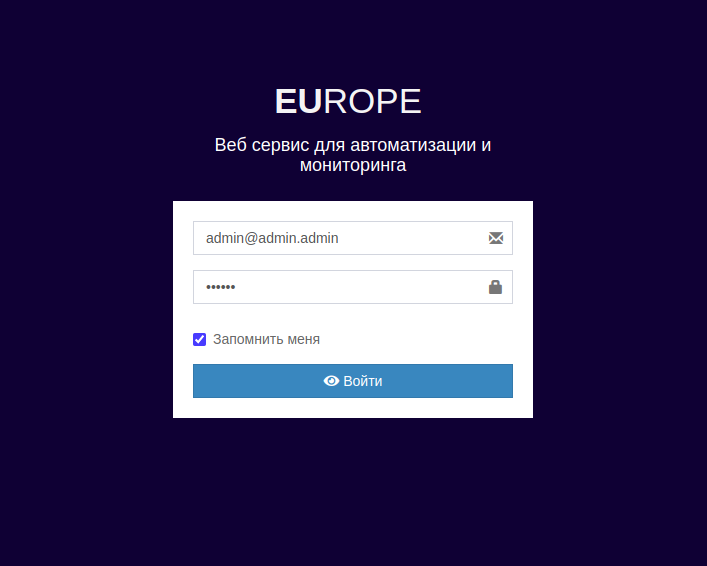
For the initial stage, the goal was set to launch a system called “EVA”. Put simply, part of the work needed to be done not by employees, but by a robot. More specifically, for regular collection, monitoring, and analysis of data on the company’s competitors and customers in order to automate operational decisions within the framework of target performance indicators.
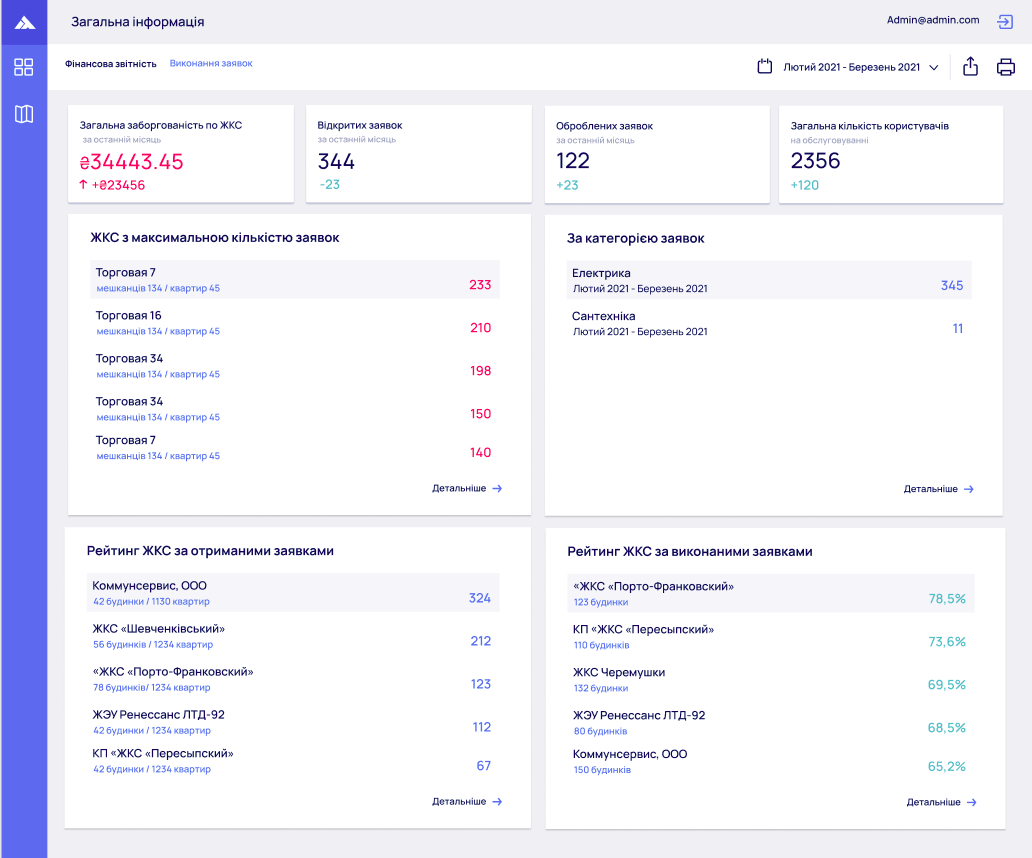
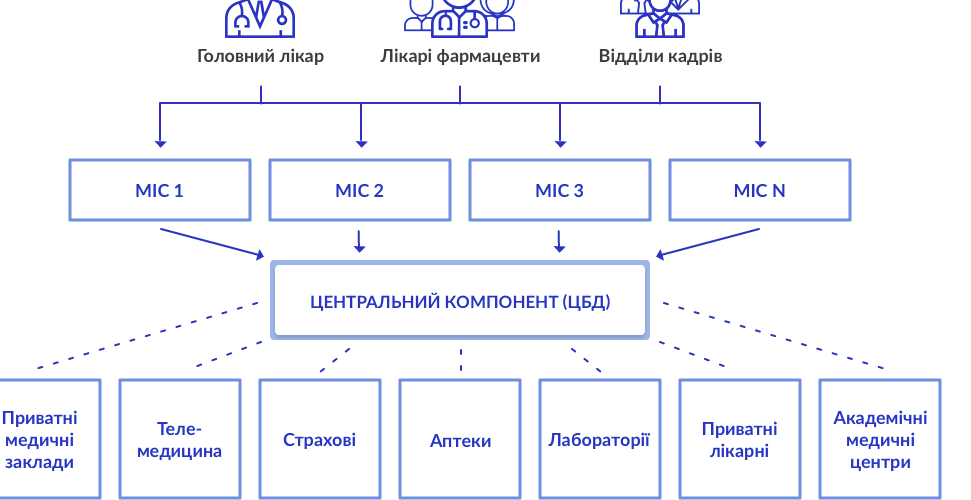
Of course, due to the NDA, we cannot go into specifics and nuances, but the essence is this: employees of the analytics department and the company’s top managers must have a tool that collects data from various resources around the clock, continuously and automatically, displays this data, allows working with this data, building charts, pivot tables, creating complex joins and filters. The system also allows setting various goals (in specific numerical indicators), and based on these goals, certain tasks will arise for various departments of the company and freelance employees.
Complex data mining
One of the significant challenges was that Amazon blocks the ability to collect this kind of data in every possible way, even for its partners, but provides a special programming interface for some data. This data is not sufficient for the company’s goals.
Therefore, this is not just parsing, but rather complex mining with bypassing intelligent blocks by various means; it is an analysis of the functioning of Amazon’s servers, while naturally having no access to Amazon’s source code. It is necessary to imagine and reconstruct Amazon’s operating algorithms based on very indirect signs.
Technically and legally, collecting data is not prohibited, so Amazon makes it incredibly difficult; as a result, most competitors and their staffs of programmers cannot obtain the necessary data, because this is not a task for an average developer and not even every experienced programmer can handle it. It requires not only the ability to write interservice requests, but also the ability to conduct deep analysis of HTTP headers, compare it with time intervals, use special tools such as traffic analyzers...
Our task was to convince Amazon’s complex anti-bot algorithms that we are human, that is, to write a full-fledged program for simulating user, supposedly “human”, actions. How we did this together with a very experienced technical director, with whom we worked as a team, is a trade secret and an extremely interesting experience.
Syntactic analysis of marketplace data
After obtaining the data, everything is only just beginning. After all, this data was not intended for human reading at all. This data is needed for standard browser analyzers and contains 98% junk required for its correct display and positioning on the page.
To find the necessary information, complex syntactic analysis is required. Unlike programming interfaces, where everything is served “on a platter” in a relatively convenient XML tree, here every byte of information has to be fought for, every digit is won back by writing and debugging specific functions.
The requirements for the algorithms also included the need for their resilience. Since another specific feature of a giant like Amazon is that it constantly “rolls out” new changes. And if the algorithms are written “carelessly”, they may work today and be useless tomorrow. They must work almost intelligently, analyzing the received raw material with markup and data in the same way a human analyzes it.
And even with a professional approach, we sometimes faced the need to adjust these algorithms. What can I say, sometimes even a living intelligent person finds it difficult to locate the necessary data in light of all the filters and zoning. Those who have worked with this will understand me =)
Labor productivity
In 5 days, a huge amount of code was added to the system thanks to the development team. We are not talking about drafts, but about debugged and optimized code that meets complex quality requirements.
Legacy of old projects
Another point of complexity, although not the most significant, was that the company had many different formats, reports, algorithms, and software developments that had allowed them to work until then. This is normal and expected. But in light of the enormous volume and complexity, we had to spend hours communicating with company representatives, studying not only their developments, but also certain aspects of their work, because what was self-evident to them was a dark forest to us. However, for us this is a normal process; we immersed ourselves with curiosity in all the subtleties, asked questions, and sometimes even contributed our own fresh ideas, which surprised both seasoned experienced employees and the owners, with whom we also had the opportunity to speak (one of the owners spoke Russian, so we easily understood each other).
Infrastructure
A few words need to be said about the infrastructure. Of course, within what is permitted and not secret. A separate specialist architect and DevOps were brought in to create the infrastructure. The deployment and delivery system was deployed using the Kubernates container orchestration platform and the Jenkins automation server. Of course, Docker was used for development and testing purposes; dev servers, staging, and production were introduced. Git based on a premium github account was used as the version control system. The servers were configured on Digital Ocean.
Documentation was developed, using which we logged into the Jenkins account and managed delivery, monitored deployment status, launched new microservices, managed hooks, worked with service configurations, configured background processes, and much more. There were many non-obvious nuances in the course of building the infrastructure, which, alas, must remain unspoken.
Microservice architecture
Almost always, when clients turn to us, they expect deep expertise from us not only in programming, but also in choosing key technical solutions for the business - that is, architectural solutions. This is exactly what a top-tier technical specialist does - a system architect.
This project also expected responsible technical decisions from us, but one decision was dictated to us from the very beginning - microservice architecture.
Based on the input data, we challenged this decision in favor of initially developing a modular system, a layered system, concentrating efforts on creating and testing a clear and normalized domain model as the core and support of the system and the entire project. Later, the system could have been divided by contexts and convenient “lines” of demarcation into microservices could have been calculated. That is, we denied the convenience of what is called “microservice first”.
However, the decision on microservice architecture had already been made, and because we might not have known some nuances and subtleties in the company’s future goals (and studying such a volume during the first consultations was not possible), we accepted the idea of developing the system starting with microservice architecture. An experienced architect was brought into the team, whose task was to split the system into microservices and consult on how to connect them. The architect on our side was responsible for the so-called interior architecture, which was closer to the domain area and object-oriented analysis.
We also comforted ourselves with the fact that, in a certain sense, we were not making microservices from scratch, because the company already had somewhat dispersed software developments in the form of huge algorithms attached to the spreadsheet system, as well as a somewhat denormalized database and so-called legacy code on Zend Framework (now this is not a trade secret due to the replacement of the solution). Later it turned out that it was not possible to reuse and “cut off” microservices from these developments. The developments served more as a prototype than as reusable subsystems, and certainly could not become microservices.

As predicted, problems with microservices arose. It cannot be said that this was the fault of the consulting architect or the technical director, since methodologically everything was done correctly; decisions on microservice design were made jointly, by the whole team (not only the team on our side, but also the entire team with all the involved experts and the company’s staff employees), but overall this was expected, because the mistake was to start with microservice architecture rather than arrive at it gradually and organically.
Again, it is not possible to describe the key problems in full detail, but the general essence was that at the initial stage it was impossible to precisely determine the boundaries of the microservices (this is the most difficult task and is usually calculated empirically, through observation). Thus, in order to move from design to software implementation, the division was carried out in a logical and obvious way, based on the modules that were emerging and, one might say, suggesting themselves when looking at the huge drawn diagram of the “EVA” system.
But in practice, when all the system algorithms began to be described, it turned out that some microservices had a very large number of connections. Especially in the area of complex pivot tables with complex filtering. Thus it turned out that many algorithms that the DBMS takes on and contains under the hood now had to be brought outside and rewritten when manually stitching data together, because if we had not maintained separate isolated databases for each microservice individually, we would have violated the very idea of microservice architecture. Or else duplicate data schemas from microservice to microservice and get a pile of tasks for writing algorithms for complex and non-standard synchronization. An alternative option was to introduce a bus into which the key logic of set union could be placed, but calculations showed that in total all this logic would create a fairly heavy central service. That is, the most optimal solution really was to write a monolith initially and cut into microservices only the necessary and weakly dependent functionality.
One way or another, at a certain stage we realized the mistake and were forced to admit that a fairly substantial budget had been lost irretrievably. But despite this, we were able to write extremely complex unifying algorithms and the system worked. In the course of the work, we ended up with, in some sense, a general-purpose microservice framework, which will slowly and gradually compensate for this loss, since the goals of isolating certain functionality were achieved, although not with as little bloodshed as the client initially thought.
Microservice frontend
Yes, we also planned the frontend as microservice-based. And while for the microservice backend at the start of the project there were more or less good and understandable practices and methodologies, with the frontend everything was ambiguous. We studied a number of solutions, in particular a solution that helped create truly isolated solutions on different frameworks within one system. The most delicate part, as with the backend, was the intersection of functional elements. In our case these are global components responsible, for example, for the menu, layout, filters (which are applied globally to all data; for example, it was possible to switch only to a slice of data from one marketplace and\or within a selected date range (and not only that), and then the entire application, all tables and charts would show data exclusively based on these global settings), and at the time of development there were 4 such filters, with possible expansion in the future. Less obvious (technical) global functions of the system, such as routing, for example, were also not entirely clear in terms of how to store and maintain them. Abstract object interfaces were designed that declared the method for supplying routing rules by each independent microservice.
It was decided to display some microservices through iframes, despite all the disadvantages and nuances of this approach, which we were aware of. Therefore, only functionality that was weakly dependent on the overall state of the frontend application was displayed in this way.
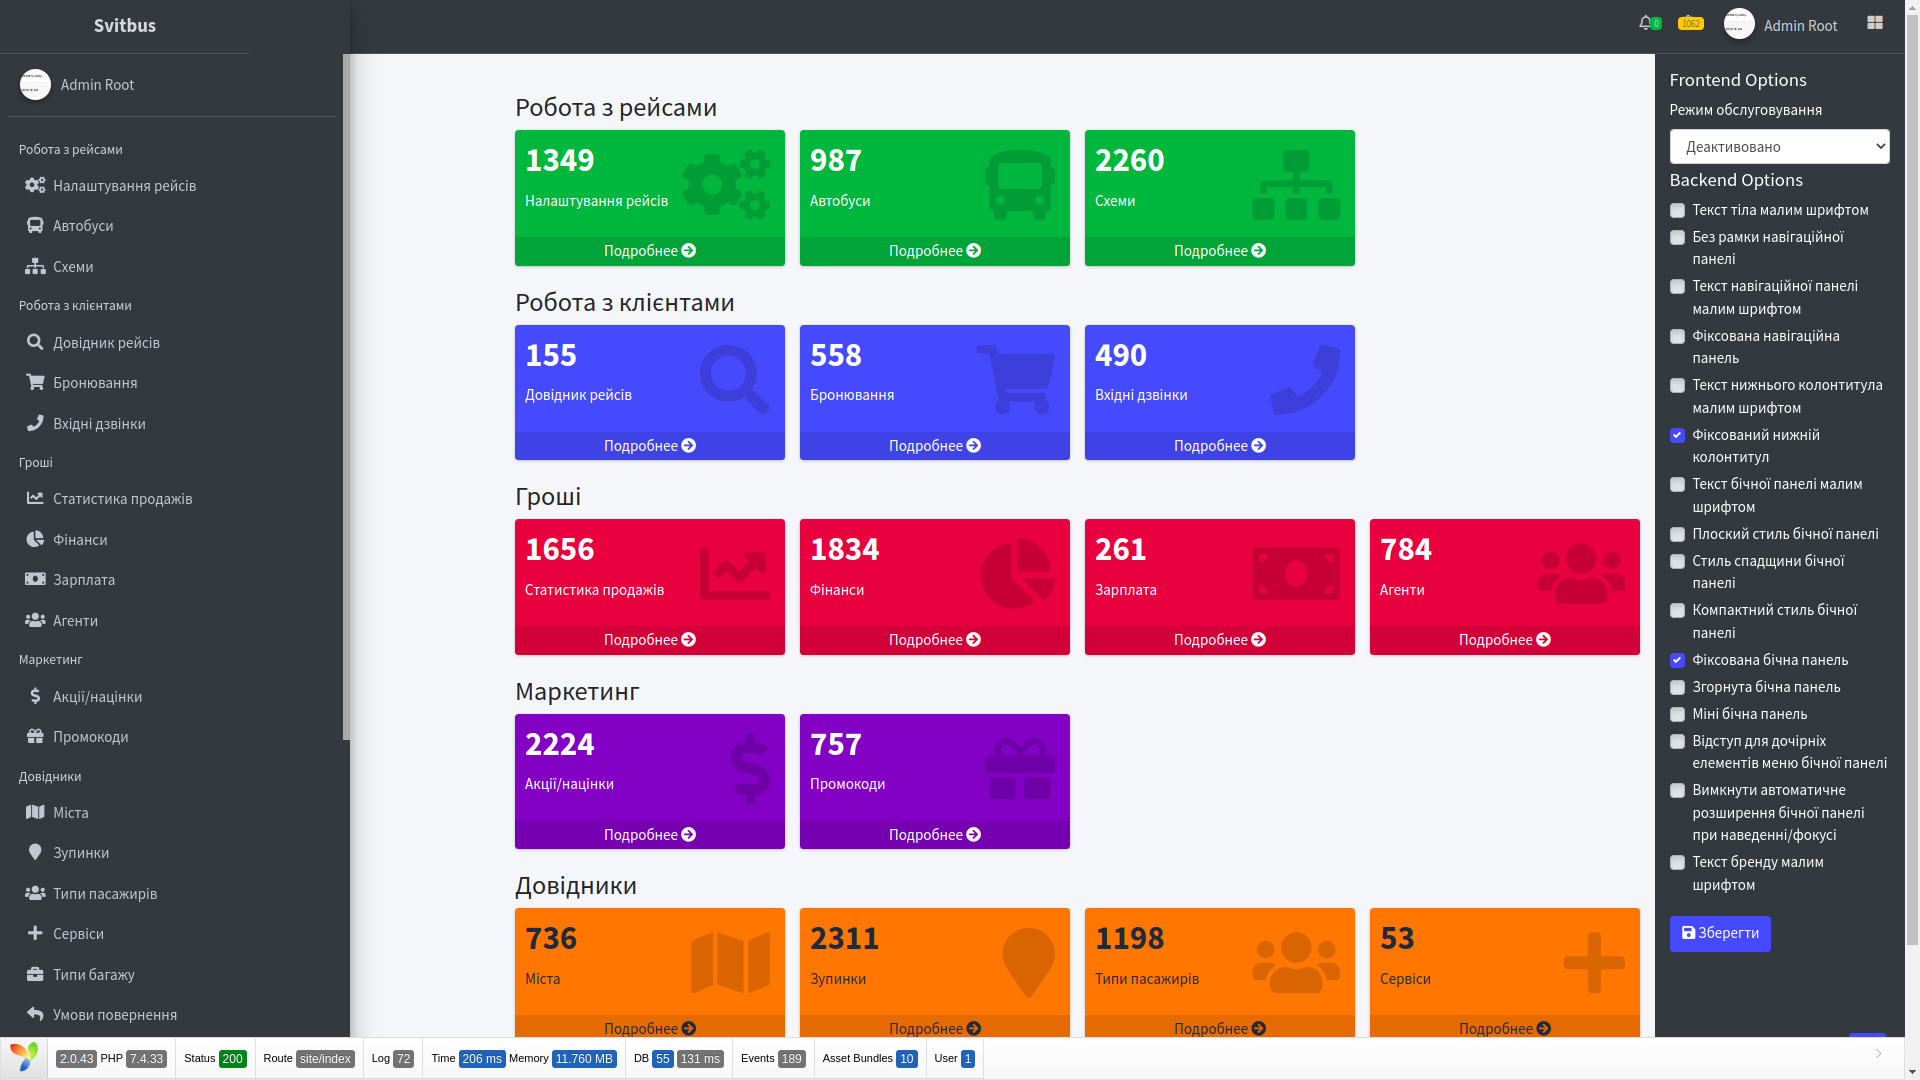
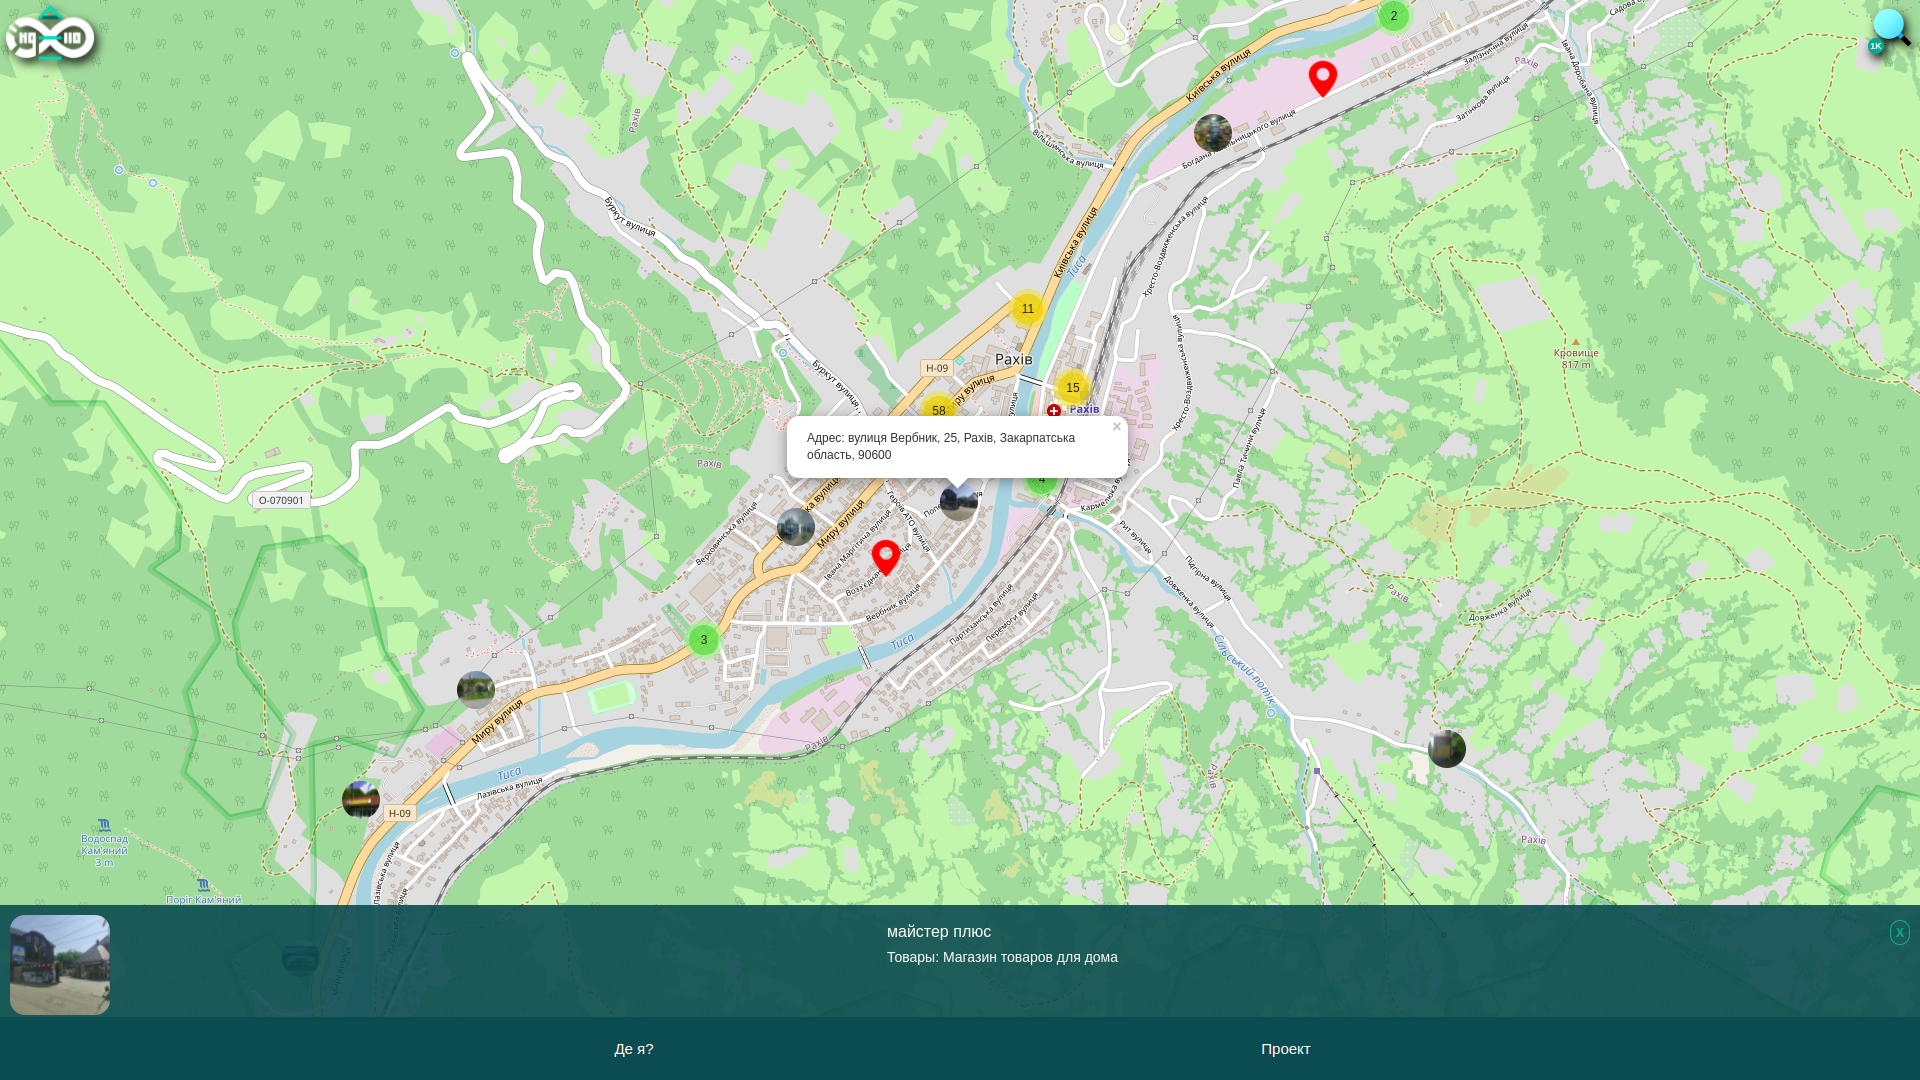
Service for monitoring and configuring monitors
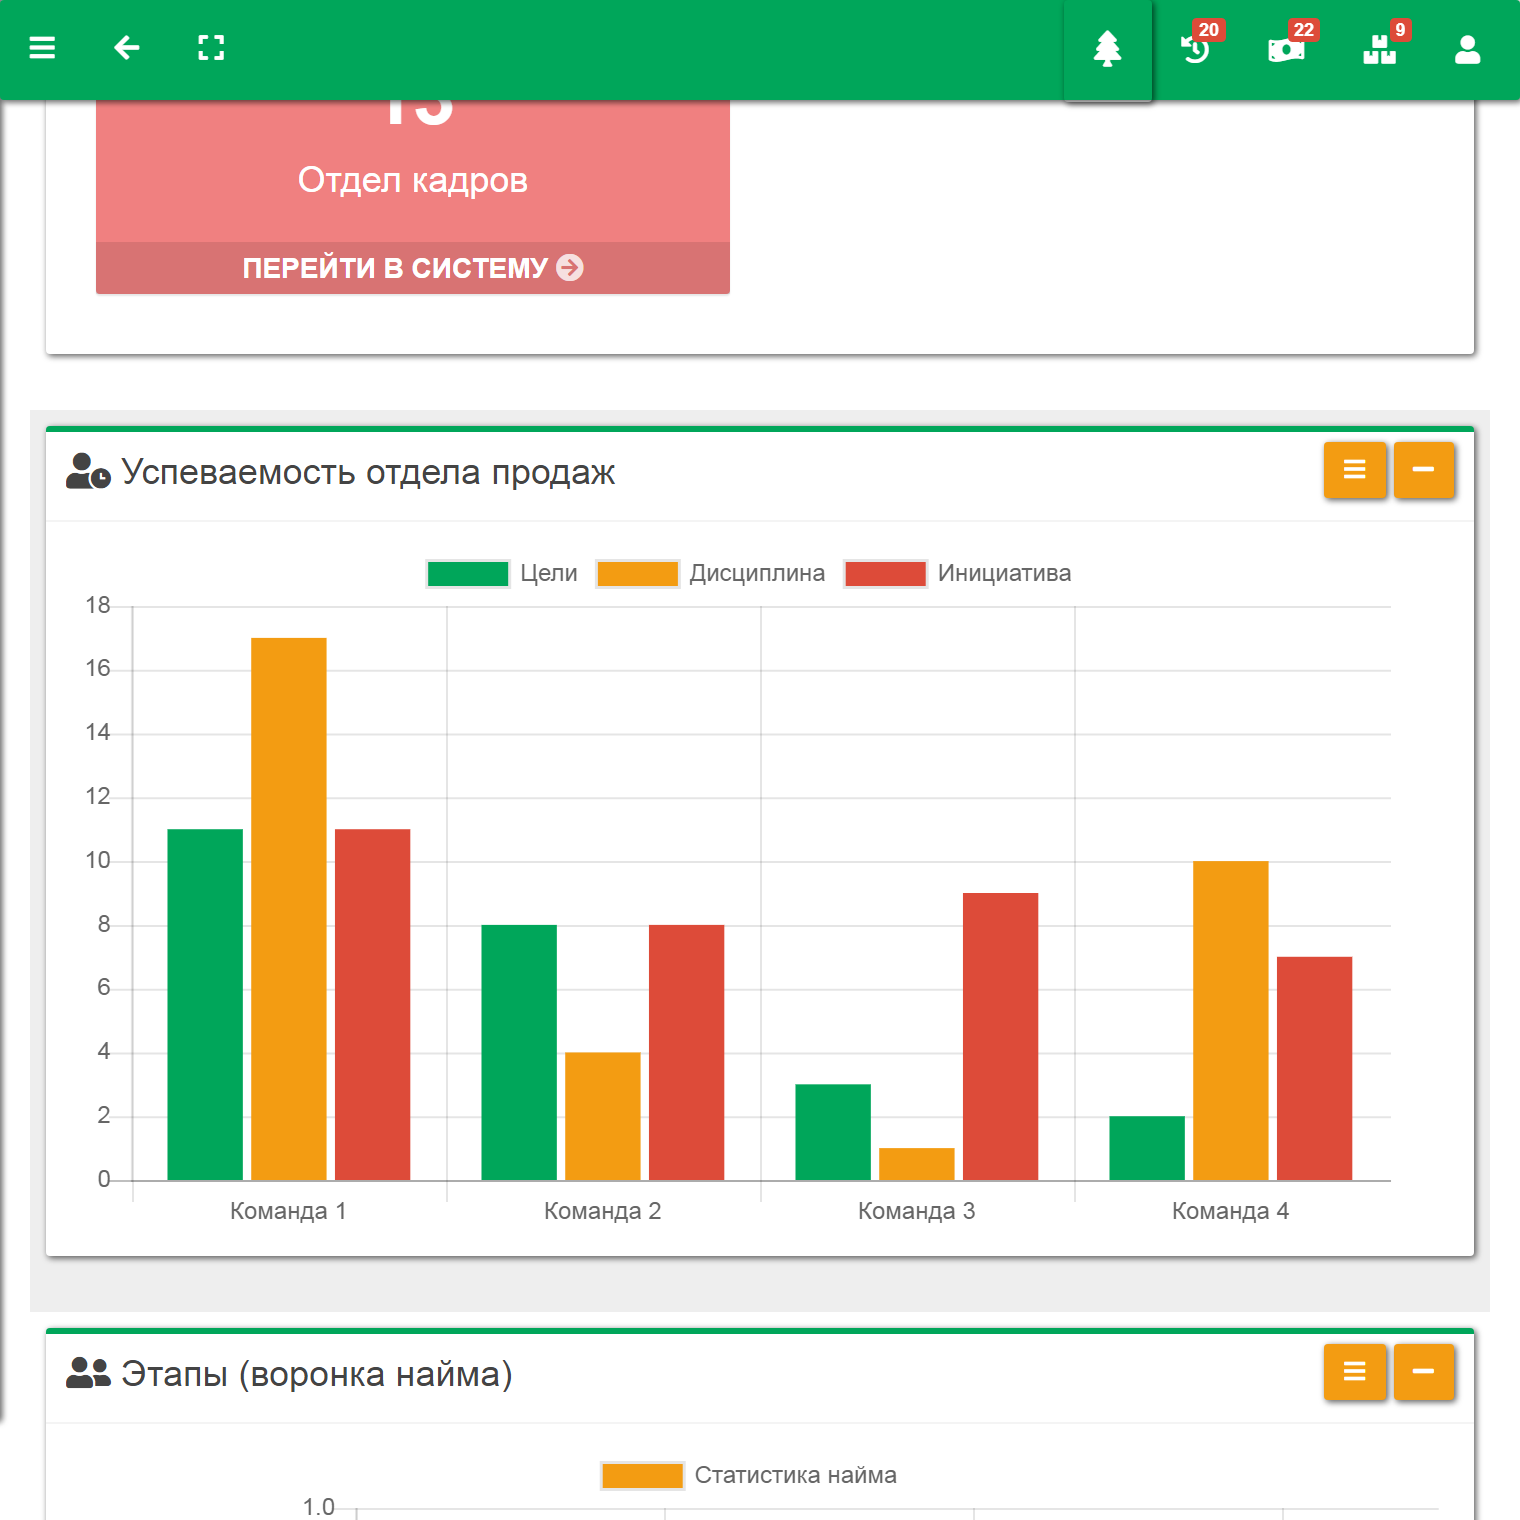
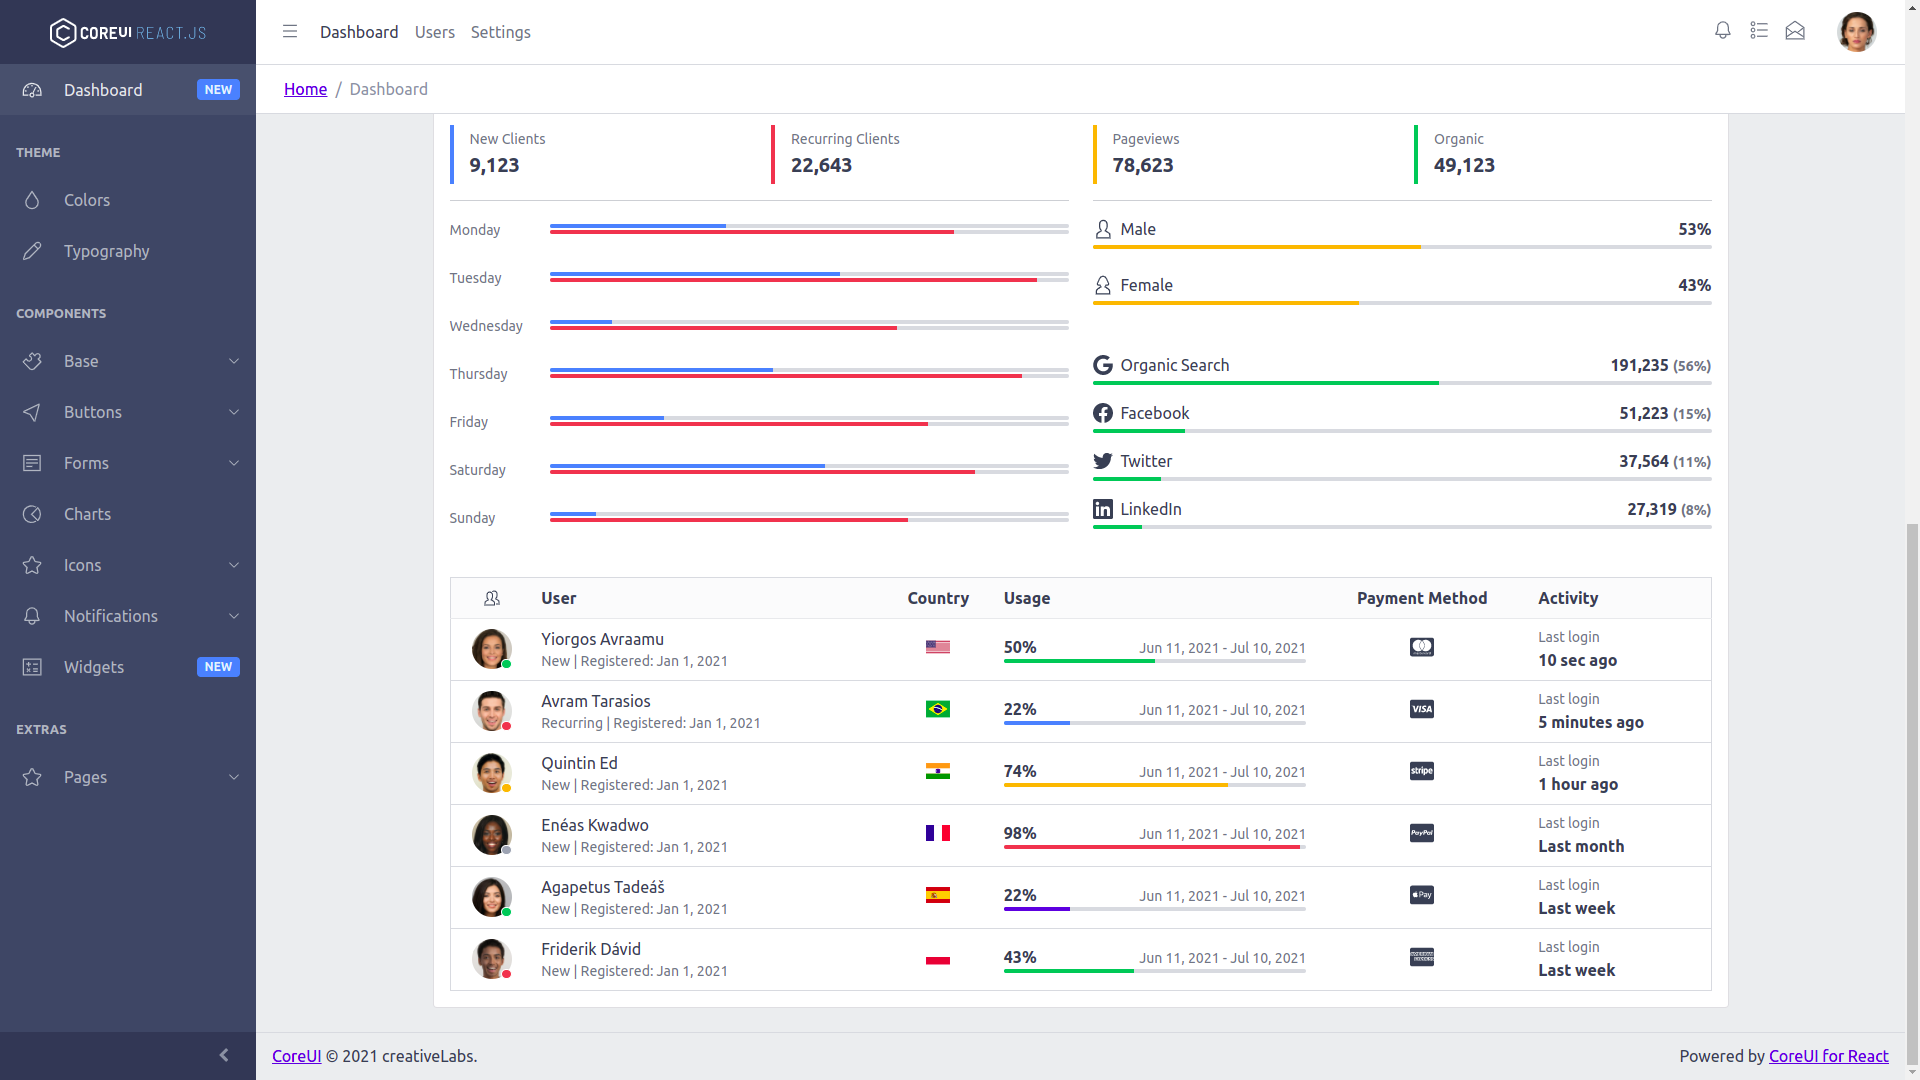
The application contained fairly complex monitor functionality. Visually, one monitor is a card that graphically displays the state of a certain data slice. And these cards were not predefined from the outset. They could be created and the slicing principle could be configured. That is, one could see the state of a specific product or group of products on a specific marketplace, their price change dynamics, comment addition dynamics, demand change dynamics, as well as derivatives of all the listed (and unmentioned) ways of viewing the market situation. The monitor was built on fresh and current data and took into account the global filters mentioned above.
A monitor was the basic unit for analytics, and from such monitors an analyst could build their own unique screen, allowing them to make various decisions - from repricing a product or groups to purchasing advertising or sending a product for review by bloggers.
Custom and flexible REST-like protocol
During the development of the application, our team developed a unique protocol. Previous developments included GraphQL, but this protocol was not used even for half of its functions, and sometimes its use only overcomplicated requests due to the not clearly thought-out formalization of requests. Therefore we abandoned this protocol, sorry Facebook.
Our protocol was ideally suited specifically to this system and was designed based on the requests that were already implied at that moment - both between microservices and client-server requests. What is also important, the protocol took into account some system functions planned for the future, which were forecast together with the analytics department and the technical director. The protocol took into account the above-mentioned global filters and had management flexibility (for example, it allowed building complex requests with set union or grouping, which made it possible to implement new functions on the frontend without additional programming). A unique capability of the protocol was a request parameter that allows making a request to one microservice and commanding it to join data with another microservice. Such inventions were local know-how, since we did not find similar functionality in ready-made form. It is important to understand that the protocol was not just an idea and a format. It was a group of fairly clever algorithms that ensured its operation. The goal of the protocol was to significantly accelerate development under conditions of environmental heterogeneity and variety of data formats. The protocol brought everything to a common denominator and set development discipline, architectural clarity, and visibility of programming interfaces. Of course, the protocol was well documented and naturally contained security rules (such as whitelists), which did not allow the frontend and other microservices to request data for which there was no permission within the scope of authorization.
HATEOAS
https://ru.wikipedia.org/wiki/HATEOAS
One of the legacies of the REST protocol was the use of hypermedia requests. This made it possible, within the response, to provide additional data about the requested resource, for example the requests that were supported within this resource. This made it possible to implement interesting ideas, such as an automated and unified way to build data tables and charts; thus, for example, on the frontend (mostly React Redux), functionality was written that did not hardcode all actions with a set of data, but automatically output it based on hypermedia. This brought all typical data renders to a single format and eliminated a huge amount of unnecessary code. The frontend developers, having understood this aspect of the architecture, enthusiastically asked many times - “What, was it always possible to do it this way? Why didn’t we integrate like this before!”. And they can be understood, because it took a lot of routine off their shoulders. But we are only getting to the most interesting part…
Metadata
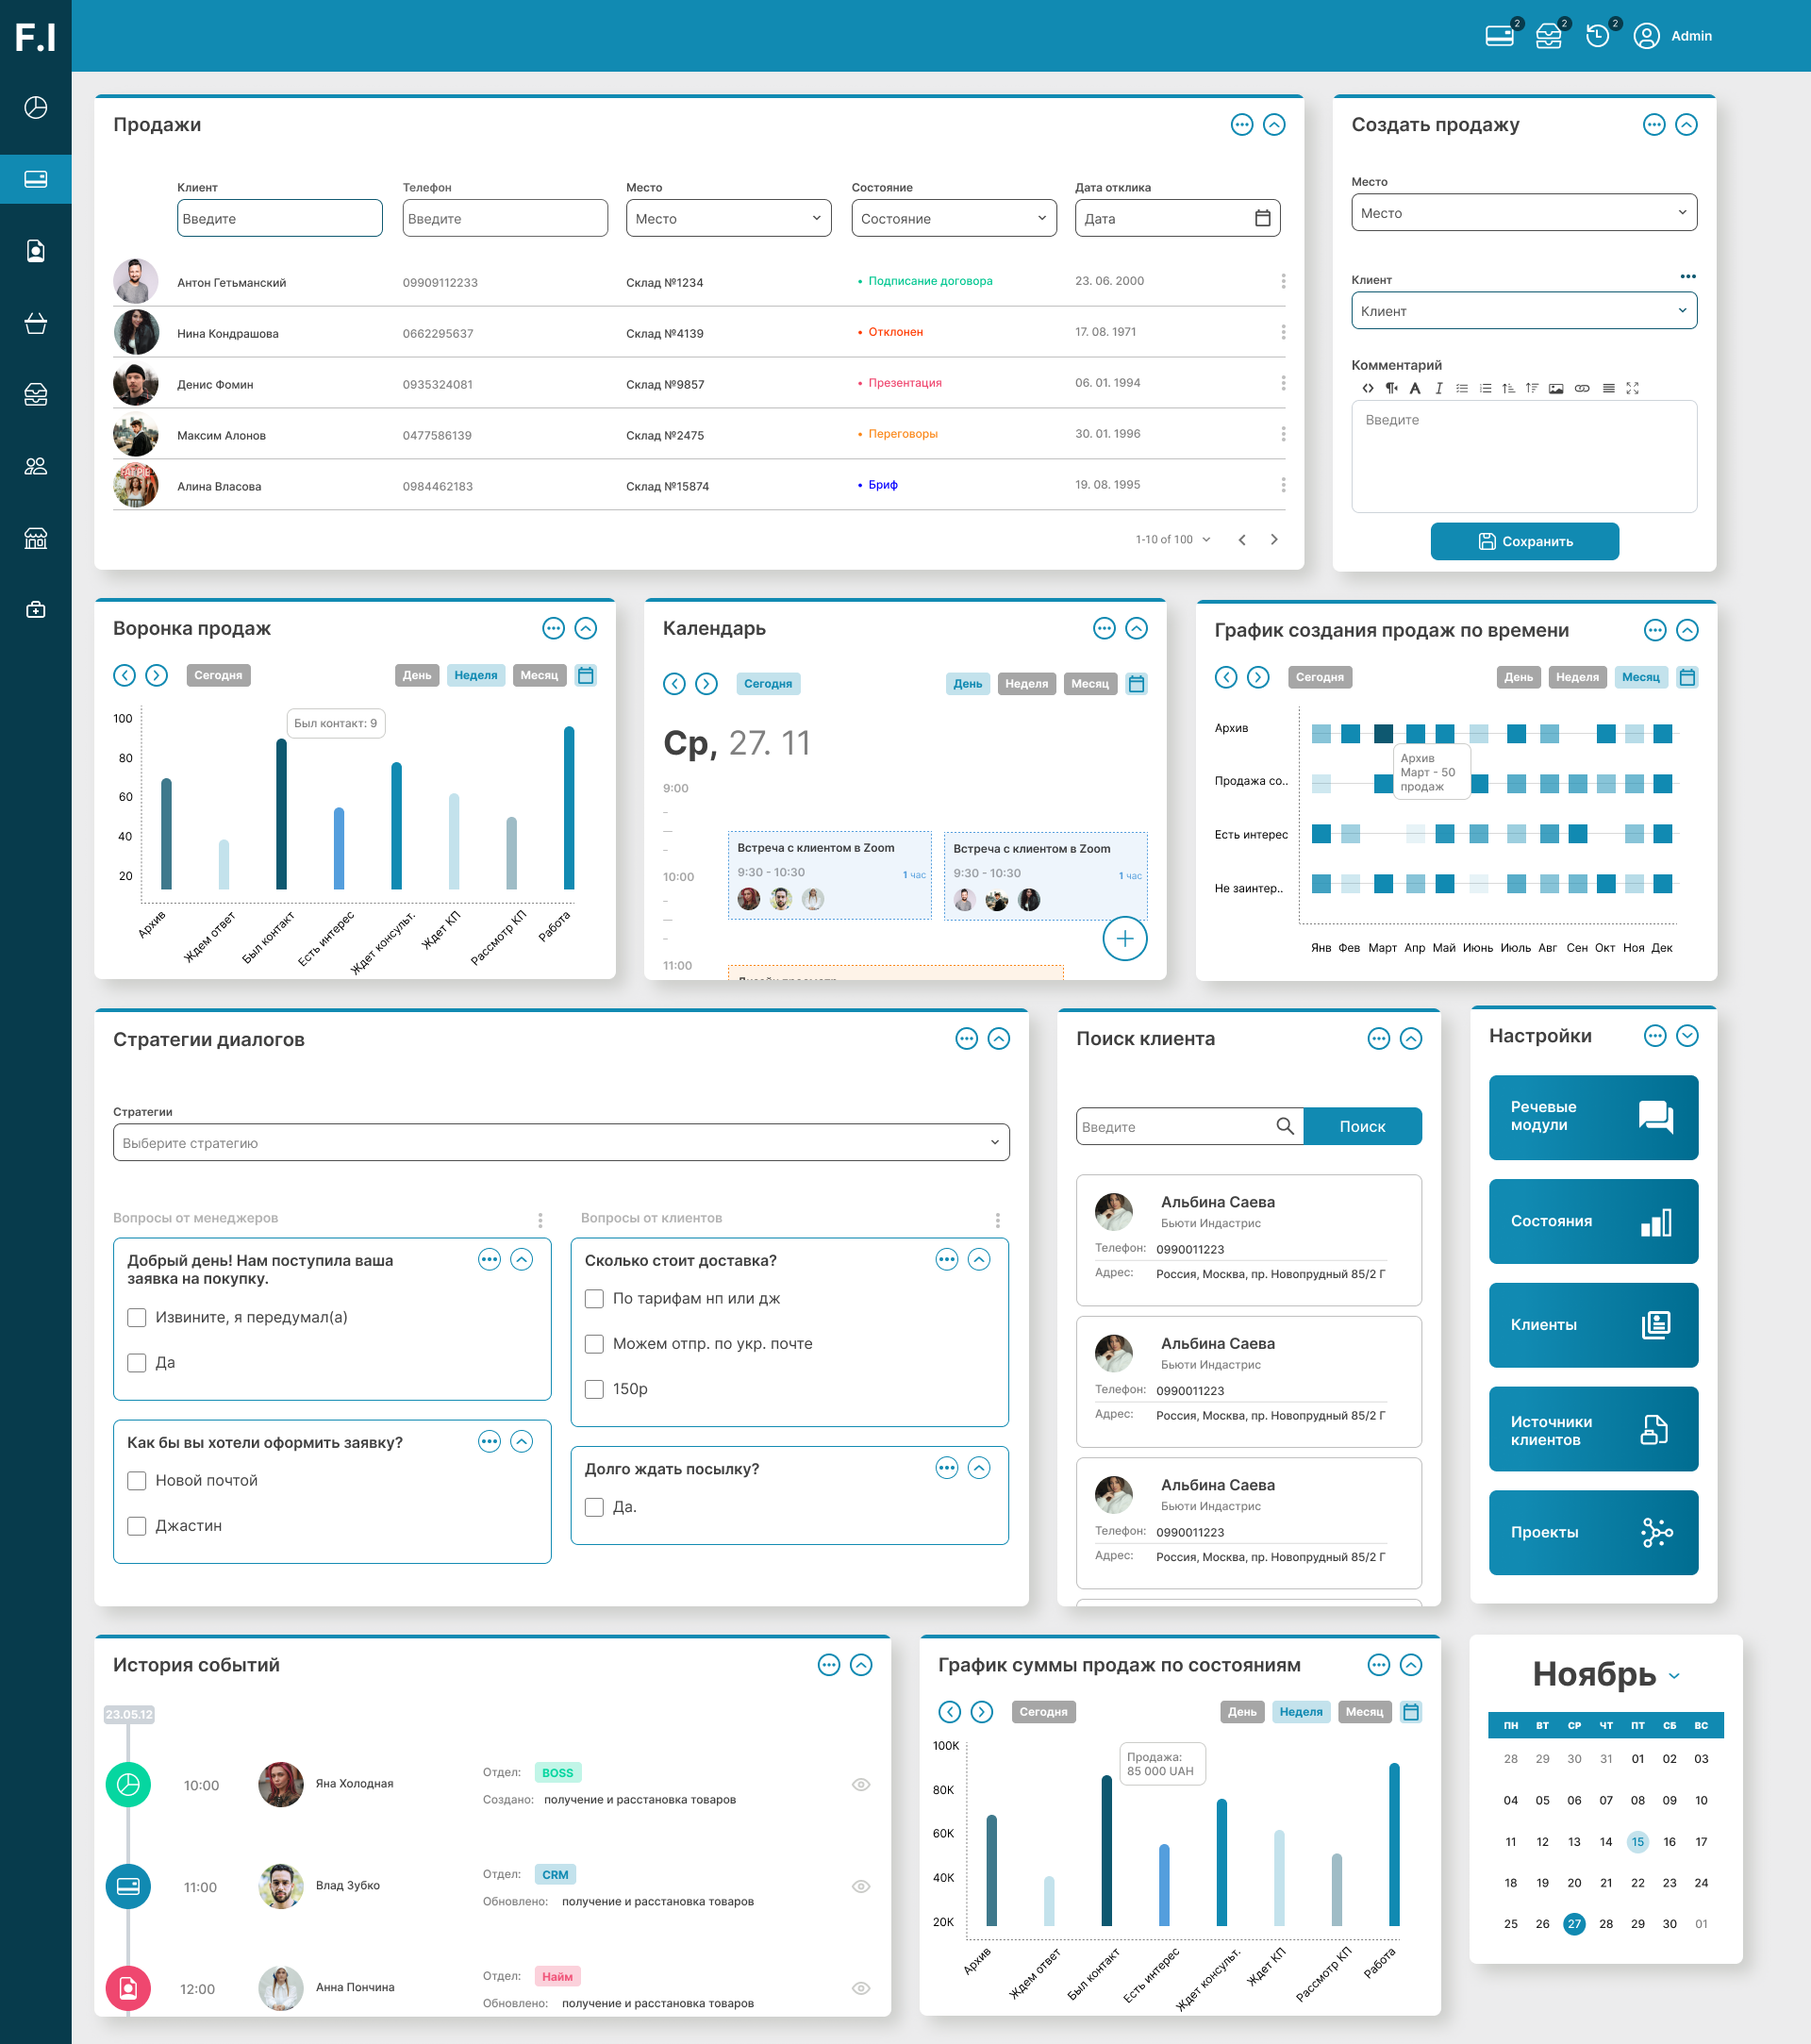
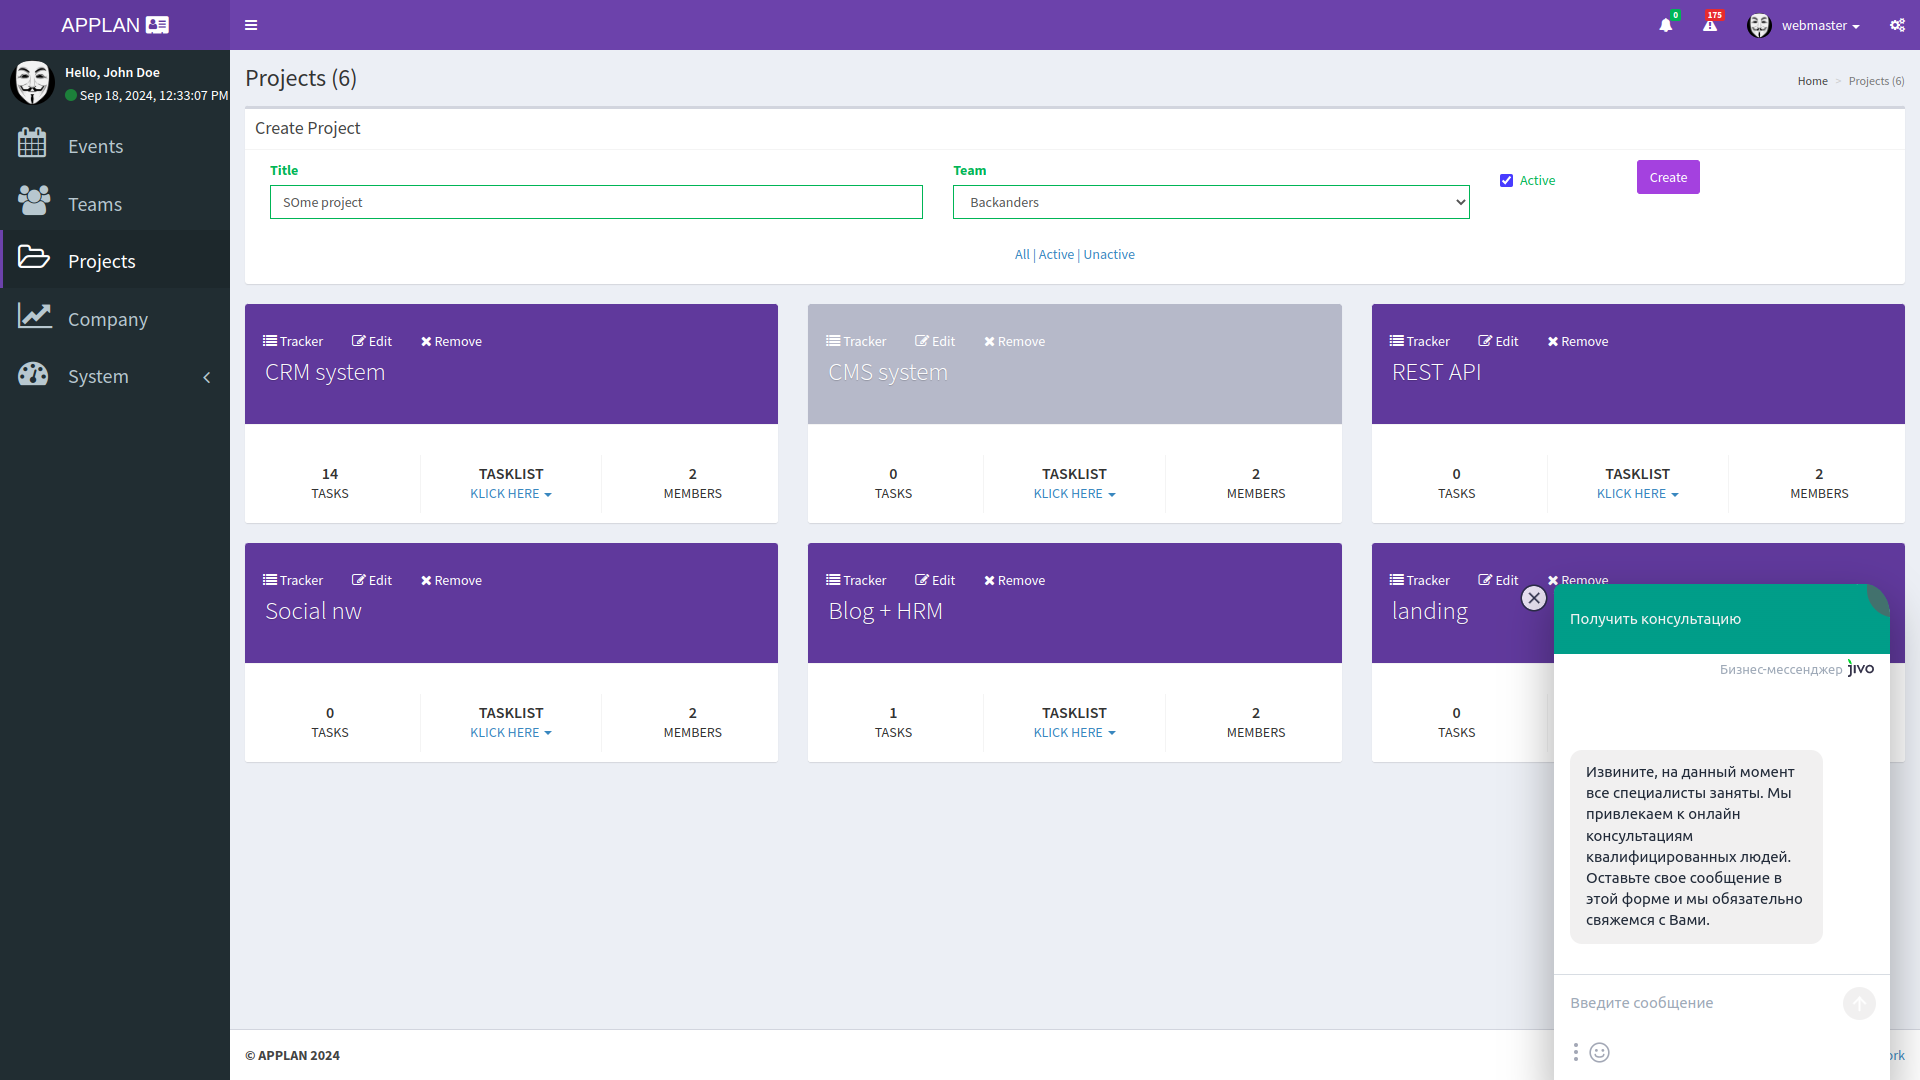
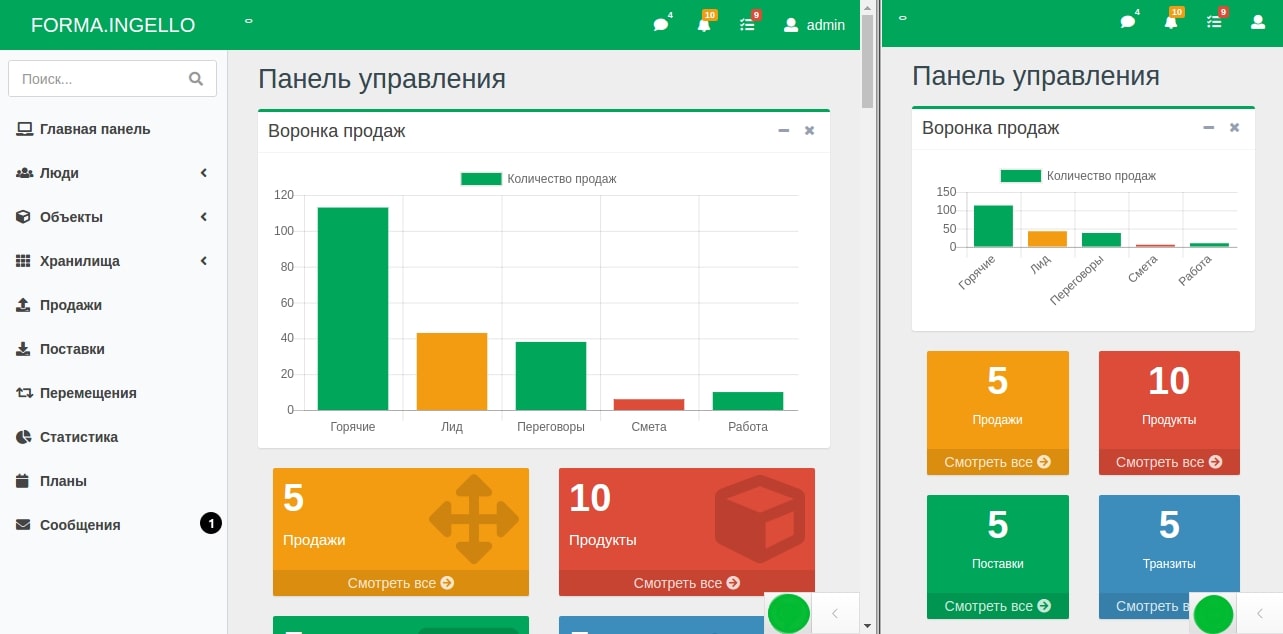
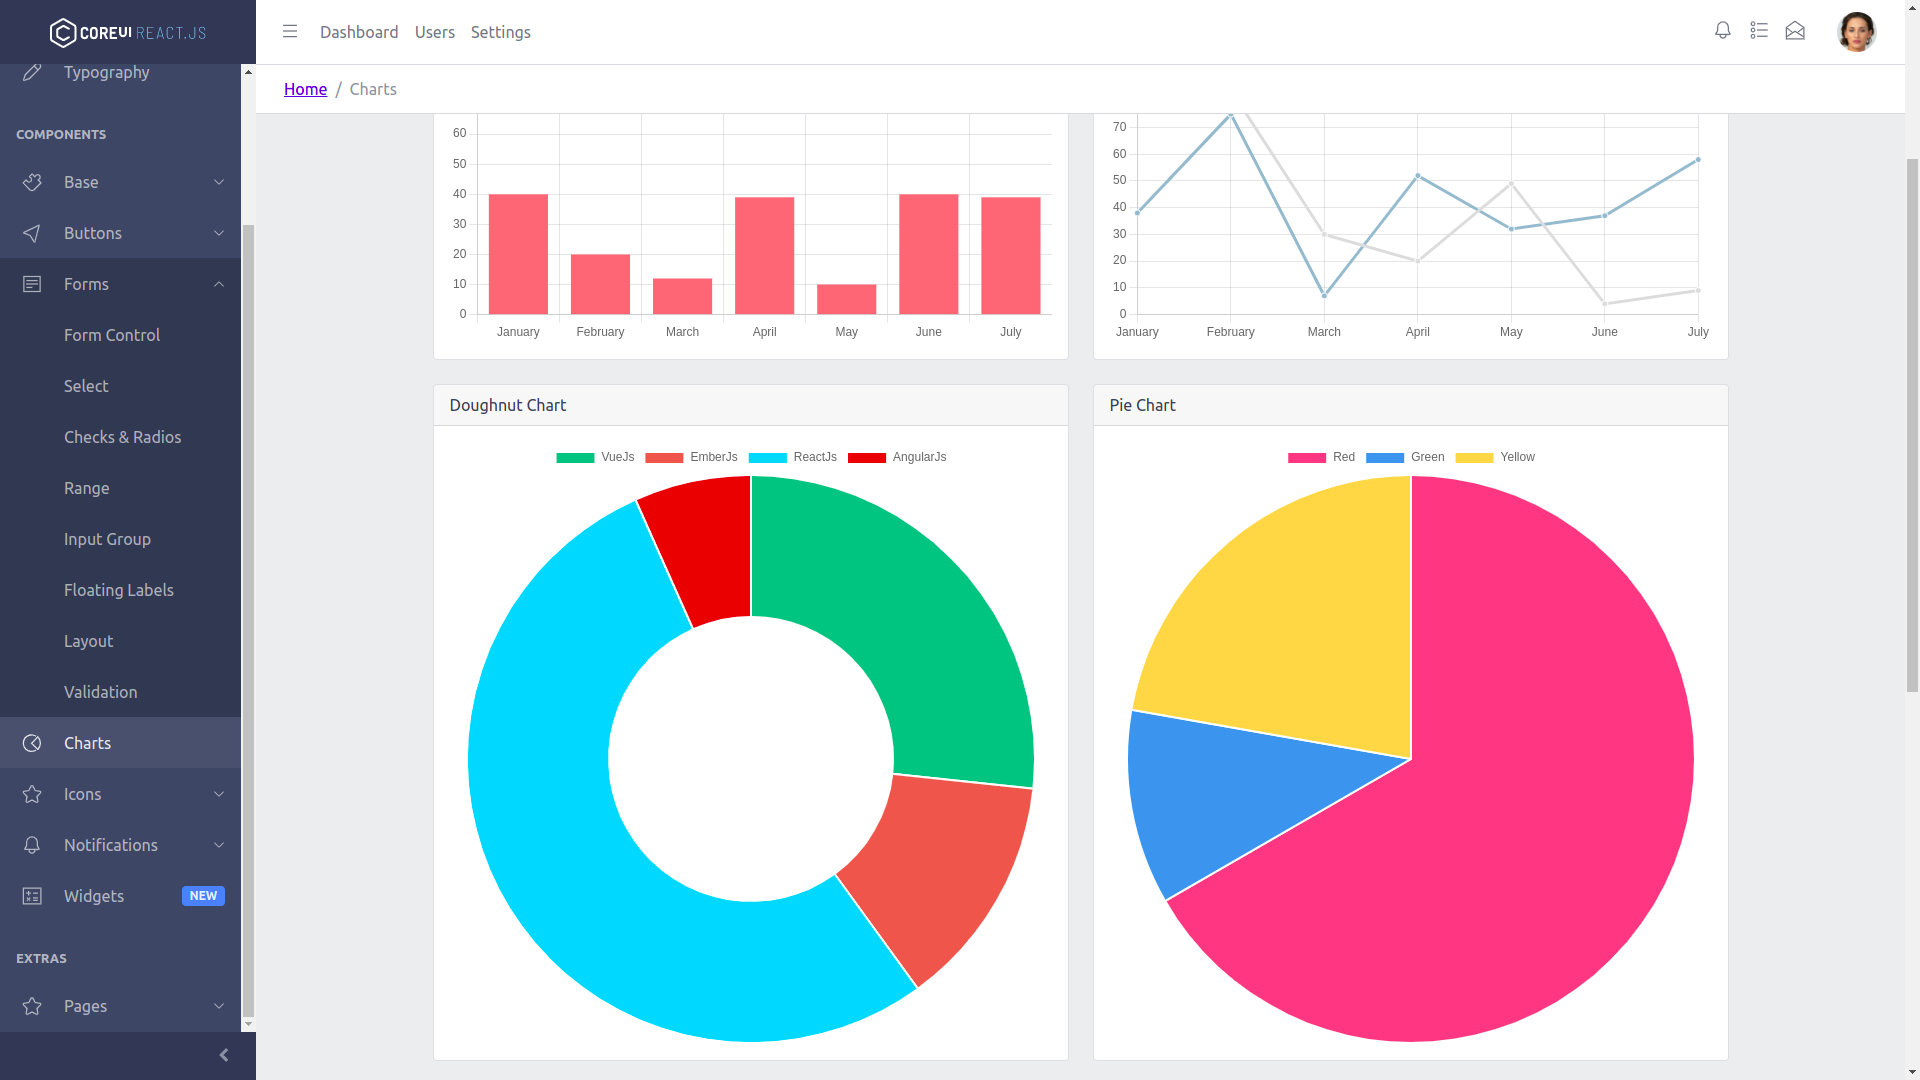
This is the most interesting invention within this project. Back at the start, thanks to the analysis and design stage, the architect noticed that a significant part of the data in the project had fairly typical shells for display. The applications were created for analysts, and unlike clients, they do not need colorful and minimalist interfaces. On the contrary, they need there to be a lot of data on the page, for this data to be accurate, for the interface to work quickly and precisely, and for similar things to have a similar display method. Thus, a great deal of data was displayed in rich multifunctional grid tables and was coupled with various charts on a two-dimensional plane. Yes, there were other display methods as well (the same monitors). But the predominant part was displayed in tables and charts.
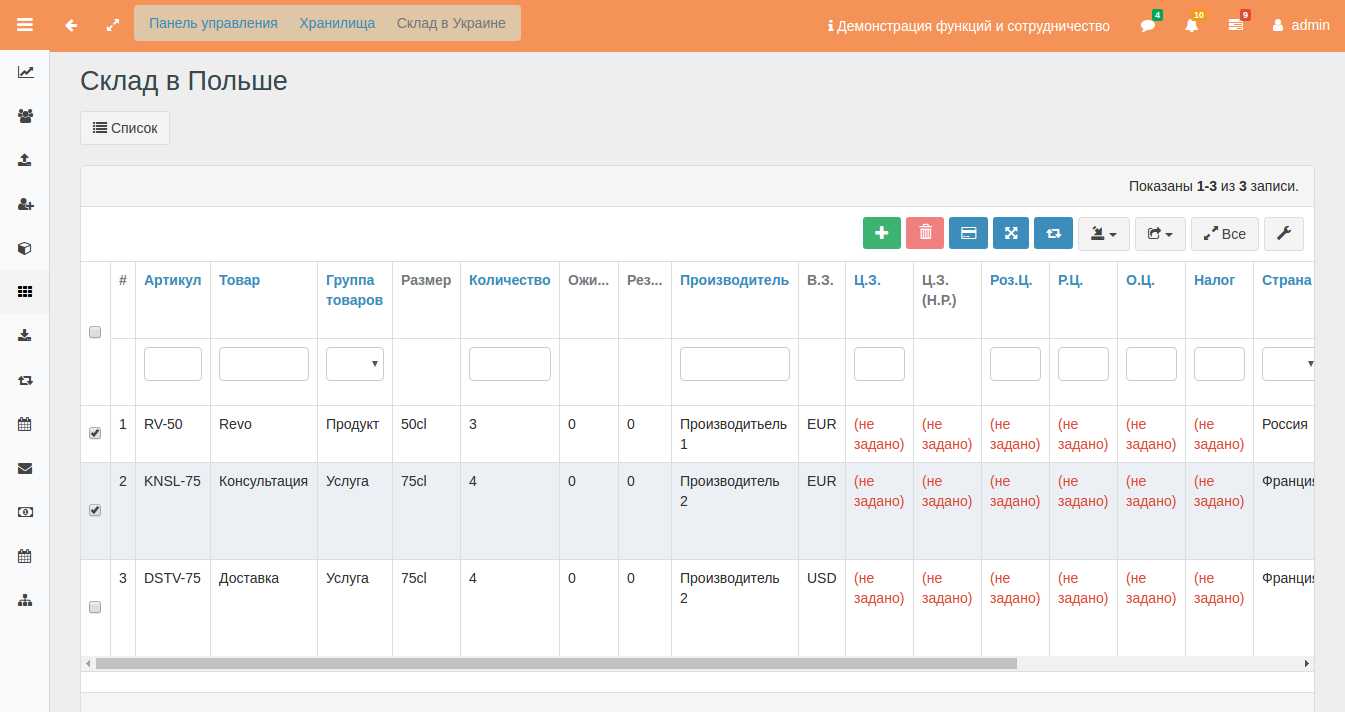
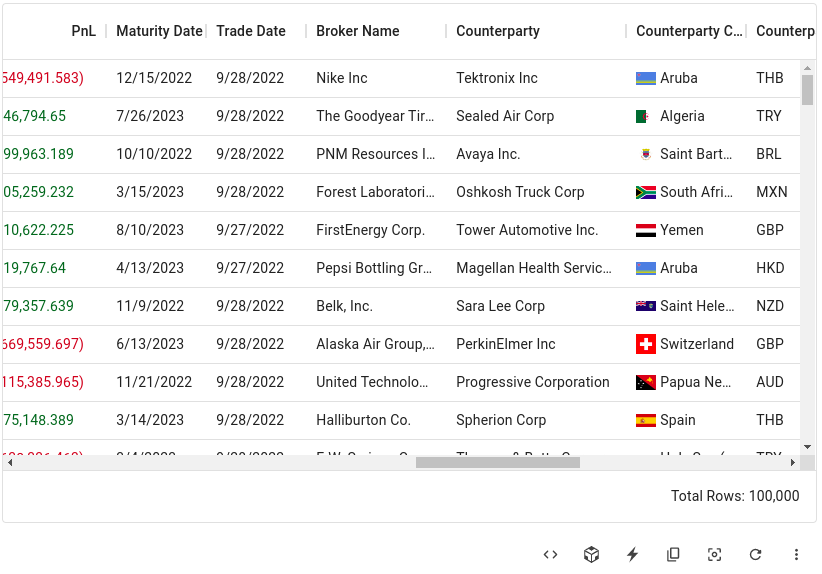
The first thing that came to mind was to standardize the tables, and that is how multifunctional polymorphic grids were designed. Their multifunctionality consisted in the fact that they had functions for sorting, pagination, complex filtering, exporting, configuring columns, their sizes and location. Their polymorphism consisted in the fact that, depending on the context, the tables could display various additional functions and filters: ranges, multiple checkboxes, and so on. It was also easy to extend the table by adding unique control elements to it that made sense only for certain data sets. Although this may seem banal to experts who develop administrative interfaces and complex corporate accounting systems, for frontend programmers it was a real gift, because they noticed a significant simplification of the work after struggling a little with implementing polymorphism in the table. They understood the essence of all related components (and an analytical grid is dozens of interdependent component objects) and rediscovered polymorphism for themselves.
Next, we went deeper into the subject area and the very essence of the system we were creating. Our team thought through and implemented a metadata mechanism. The data itself was stored mainly in the relational storages of its microservices. But this data was subject to complex filtering, validation, and complex rules for adding new data to these tables through the frontend.
Usually, these validation rules are written as separate functions on the frontend, duplicated on the backend, and extra code has to be written, and in two languages at that. Things are slightly better in isomorphic applications, where, if everything is done correctly, the validation logic is written once in one language and is not duplicated on the backend and frontend. However, in any case, validation functions are hardcoded. At best, these rules are organized as declarative statements, which simplifies their reuse (for example, when entering data into a filter input and entering similar data into, as it were, a similar input when filling out a form for adding a certain object). We went even further. We created universal metadata storages; each microservice can provide such metadata as information about itself. Validation is a vivid and clear example, but there was also other data needed both for technical needs and for frontend needs. In the metadata, we stored unique table settings: sizes, positioning, cell placement; introduced data types, validation rules, some preset conditions, and most importantly, we tied this to a specific user. What did this give us? First of all, a great many subtleties could be configured without a programmer and without knowing programming, for example, the sizes and appearance of tables (and charts too), the logic for checking data, their types (for example, if the type of a set property is “date”, then when adding this data or when using the filter form in the table, this data will be displayed as a date picker and validated against a date format unified for the entire system). It was also possible to add custom rules, also without programmers. An additional convenience was the ability for an analyst to configure a table with a preset filter. That is, for example, Vasya views the product table sorted by date, while Petya finds it more convenient to analyze products sorted alphabetically; this can be configured. And the same table will correspond to the convenience of different users.
Together with the protocol and the hypermedia mechanism described above, we obtained super-smart tables and significantly, by an order of magnitude, reduced the time needed to develop and create new tables. It is important to note. It is not appropriate to create such a constructor in every project, far from every project. After all, you risk spending a huge amount of time developing universal functionality that will not be reusable. For such a bold step, it is necessary to analyze requirements, and not only current ones, but also potential ones, for years ahead. In this project, it was obvious that creating such metadata functionality would create the necessary development discipline and save a lot of time and effort on development.
There were other interesting and innovative inventions in the project, but since they were developed either by another team and another architect, or jointly and without personal authorship, these solutions will not be described.
Official consent was obtained from the project management for the description and even partial non-competing use of the inventions described above in other projects (only the main metadata core, without being tied to this subject area).
Conclusions: a project architect can save your project a lot of money. Ignoring the architect's opinion is fraught with financial losses. The absence of an architect in a complex project makes the chances of its development minimal. Most likely, the system will not work as expected and over time will be redesigned and rewritten with the involvement of an architecture specialist.
Contact us for a detailed consultation before starting a project; it is free and informative.